Friday 30 March 2012

Fractal System: TTM Bars

I was thinking about including the indicator TTM to my fractal system. I've used the TTM indicator in a number of systems I've setup, but the TTM is always just one bar short of giving me my perfect system. However, now that I have a fast trend following system (the Fractal System), and a great positioning method, I might have a use for the TTM once more.

The Fractal System will essentially filter out false signals made by the TTM, and subsequently the TTM will filter out false signals made by the Fractals. This is the idea anyway. Still need to test a few things before I give the thumbs up, but so far so good.

The idea is this:
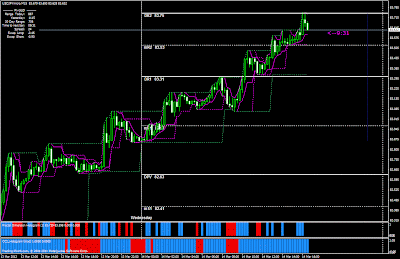
The TTM will typically display after the 2nd bar has closed (keep that in mind when looking at the picture; I would hate to have you think that the TTM bars are displayed at the close of the current bar).

In addition to TTM and the Fractal indicators we use a method called 2nd Bar Low/High. This method involves using the high and the low of the two previous bars to determine the entry and exit points: for example, if price passes the High of the two previous bars, then that would be our entry point, and the stoploss would be the Low of the two previous bars (vice versa for price passing the Low of the two previous bars).

This 2nd Bar Low/High is kind of what my Fractal Dimension Channel/Histogram does, only it's a little more selective. So I will be using the 2nd Bar Low/High mostly for stoploss values, and the Fractal Indicators as my entry points.

Setup is this:

  • When TTM displays a Orange or Green Bar, we wait for the Fractal Histogram to display a Red or Blue Bar for our entry. 
  • Stoploss is the 2nd Bar Low/High;
  • TakeProfit (70% of order) is set a the next support level, or just 10-30 points from entry;
  • Remainder of the order (30%) will be trailing the 2nd Bar Low/High stoploss for any further profit points.


RSI Divergence: New Territory

Hey everyone, I haven't been posting at all these past two weeks because I'm still trying to work a possible system with fractals. I believe I'm close to something here, but I'm still having problems with the all-so-many false signals. Still not giving up on it, but I have been looking around for a different setup. Which brings me to today's topic: RSI Divergence!

I've posted about this topic before in my blog, but I failed to notice this very interesting divergence pattern.
I call this pattern the Itty-Bitty-Tiny-Little-Winnie RSI Divergence.

This RSI Divergence pattern comes when the price makes a new High/Low, but the bar displayed is a down bar (if new High is made) or a up bar (if a new Low is made), and RSI is showing a decrease (if a new High is made) or a increase (if a new Low is made).

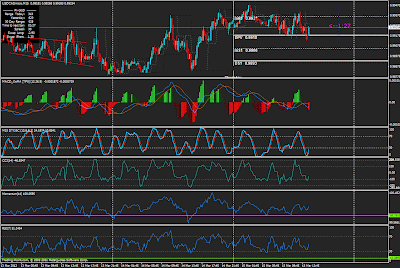
This might sound a little confusing, so I made you a picture (blue lines show the Itty-Bitty-Tiny-Little-Winnie RSI Divergence):


You can see from the picture that it can get most of the major tops and bottoms, which is wonderful for the everyday swing trader. I should also attach some rules to this pattern:

      -   If you make an entry using this pattern, then enter at the High/Low of the Diverging Bar
          (the bar that displays the pattern).

      -   The Diverging Bar should be the opposite colour of the previous bar

      -   This Divergence pattern should only occur between two bars (which is why I call it the
           Itty-Bitty-Tiny-Little-Winnie RSI Divergence)

So, if the Diverging Bar is displaying a downward reversal, then the entry point would be the Low of that Diverging Bar (opposite if the Diverging Bar is displaying a upward reversal).

I've seen this pattern on all timeframes and all markets, so if you want to include this pattern in your RSI Divergence armory then it could give you that nice reversal confirmation. I will also tell you that this pattern does not work 100% of the time (like all things that deal with markets). There are false signals, so cover your ass with a stoploss. 


P.S. I may not have marked EVERY Itty-Bitty-Tiny-Little-Winnie RSI Divergence Pattern on the chart displayed, so if you see one don't think I'm ignoring it, I just didn't see it is all.

Thursday 22 March 2012

Armada Markets: Available For Canadians!

I just recently signed on to Armada Markets, and asked them if they allow customers from Canada. I received a email (with 30 minutes of sending it by the way) from Armada saying:

"Both Armada Markets and LMAX Exchange accept clients from Canada"

This is a very welcomed relief since I saw on a Armada forum from the Forex Factory website that they do not except Canadian traders. After I deposit my funds into the Armada account and enter a trade, then I can fully verify that Canadians can trade with this company.

It is too bad that we have to dig so hard to find out if a broker is straight or crooked.  

Switching My Brokers

I missed yesterdays Tally (and will again today) because I decided to switch brokers, and right now I'm in that in-between area. After the problems made clear from my old broker Trading Point, I decided to switch to (hopefully) a better broker.

The broker I chose is called Armada Markets. So far from their demo accounts they seem very promising. If the demo account reflects what the live version represents (and Armada claims that it does), then their spreads look fantastic, and their no minimum TakeProfit or Stoploss will be a very welcome addition to trading system.

I will say that Trading Point did offer good customer service, and was willing to help me with my trading. I even believe that their spreads are adequate, but I cannot over look the minimum TakeProfit and Stoploss they apply to every trade.

What this means is I can't make 10 points of profit (this is after I've covered the spread) with a TakeProfit. I would have to manually exit my trade if I wanted those 10 points, which means I would have to constantly watch the price in order to catch those profit points.

Same goes for stoploss. If I wanted to put my stoploss 10 points below/above my entry point they wouldn't let me. I would have to put at a minimum of X amount below/above the entry price (the minimum depends on the market, but it can be anywhere from 10 to 150 points).

Keep this in mind when choosing a broker:
  • The lack of freedom from choosing your own TakeProfit and Stoploss levels will result in losses

Wednesday 21 March 2012

GOLD: Closed Out Of Trade

I was magically closed out of my GOLD trade today (which, by the way, would have made me several hundred point today). The only way I can explain it is that I had two EAs runnning at the same time, which caused it some confusion and simply closed out my GOLD trade.
Really pissed about about that. This was, most likely, the big move for today.

Tuesday 20 March 2012

Tally for Tuesday: +87

Mostly GOLD today again, but I did enter a trade in USD/MXN and EUR/USD. As explained in the previous post, the USD/MXN trade was suppose to exit when it reached 30 points (reached over 300 points last I looked), but the EA didn't recognize how many digits the market presented. So, I ended up losing 37 points with that trade. In addition there was a GOLD trade that resulted in a good TakeProfit, but the trailing 2 bar low/high did not work as well, and closed out with -150 points.

The -150 point trade was not an entire loss as one might think. Since this was the trailing 2 Bar Low/High portion of my trade, I only make (or in this case lost) 30% of my total order. The other 70% is the TakeProfit, which did well (+36 points). So, lets say I made it so that 1 point will give me $1, then for this trade I made $25.20 with the TakeProfit (70% of 36), and only lost $45.00 with the Trialing 2 Bar Low/High (30% of 150). If I relied just on the Trailing 2 Bar Low/High I would have lost $150, instead of $19.80 ($45 - $25.20) i did lose.

If I applied the same $1 per point with 70% for TakeProfit and 30% for Trailing 2 Bar Low/High, I would have made $69.40 (the collected profit from all 6 trades made today). If I made every trade with a $1/point and not divide them up, I would have made $87.00. But that option would apply way more risk to my trades, were as the divide method reduced my risk considerably while still giving me a profit close to the high risk option.

Problem With EA: Manage TP v2.4

I think there is a problem with the EA I'm using for my TakeProfit portion of my trade. The EA I got is called Manage TP v2.4 (Forex Factory... I think), and I believe they mentioned on the forum that 5 digit brokers didn't work. This EA is a little old, so I wouldn't be surprised if the digits were the case.

I discovered this when I traded USD/MXN, making roughly +300 points, but the EA didn't close me out (I set it at +30 points). So, I'll have to fix this. Works fine with GOLD though!

Monday 19 March 2012

Tally For Monday: -237

Well, I learned something today:
In order for this system to carry itself well, I need to make sure that the TakeProfit portion of my trade is in a tighter stoploss position. Since there will be moments when I get the 'Jump In' signal, only to find that the market suddenly changed its mind, and I cant even get a small Takeprofit. I'm still not sure how I'm going to accomplish this tighter stoploss without stopping the trade too early, but I think this is a minor set back with this system. Have to keep in mind that I cannot win every trade.

So today was less than stellar because I did not set up the Expert Adviser (EA) that would close a portion of my position automatically. This resulted in trades with large loses (-459 and -276). These trades were also not divided up (no EA present at the time to divide the allotment), so I felt the full weight of that loss. In addition, since I didn't have the EA present for my morning trades, I also missed out on any more additional gains (since I would divide my order 50/50: one for TakeProfit and the other a trailing low/high bar). Instead it was just a small TakeProfit for the full allotment.

Even though I have a negative number here today, I still managed to make back a good portion of it. I believe once I know the kinks with the EA, and work them out, I'll have a better profit for the day. So, hopefully tomorrow will work out a little better :)

P.S. I decided not to post all the trades I made today because it is rather tedious. I will tell you every trade was made in GOLD, and I made 9 trades in all.

Testing This Week: Fractal System

The more I look at this system, the more I'm falling in love with it. So, I decided to give it a week on real and live trading (small, small profits/losses though), and we shall see if this will hold up as a profit making system. I'll be still making trades with my old system if I spot anything substantial, but my main focus will be the Fractal System.

My two main markets I'll be trading in are GOLD, and EUR/USD. I'll branch out to other markets if I find myself in a high volatility moment, but for the most part it'll be these two.

I'll keep a daily tally of how many points I've won/loss on the sidebar.

Friday 16 March 2012

Tally For Friday: +18.... Tally For Week: +659

Had four trades today, with two of them being accidents (meant to make two buy orders, but accidently made two sell orders... silly me :)

EUR/USD (SELL) at 1.31687 | Stoploss: N/A | TakeProfit: N/A | Exited: 1.31719 | Profit: -32
EUR/USD (SELL) at 1.31687 | Stoploss: N/A | TakeProfit: N/A | Exited: 1.31722 | Profit:-35
 - these first two are the two trades I didn't want to order, but I thought I'd still count them

EUR/USD (BUY) at 1.31713 | Stoploss: 1.31596 | TakeProfit: 1.31740 | Exited: 1.31740 | Profit: +27
 - placed takeprofit just below a resistance point, and stoploss just below the nearest fractal point
EUR/USD (BUY) at 1.31712 | Stoploss: 1.31630 | TakeProfit: N/A | Exited: 1.31770 | Profit: +58 
 - was planning to trail the stoploss with this order, but I saw price become less volatile and a wedge
    formation was coming about. So I decided to exit while I still had profit, and it worked out perfectly

Thursday 15 March 2012

Tally For Thursday: +79

Made four trades today, the last two were for testing, but I thought I'd include them just like yesterdays test trades:

USD/CAN (BUY) at 0.99276 | Stoploss: 0.99135 | TakeProfit: 0.99285 | Exited: 0.99285 | Profit: +9
 - made call on divergence, support lines, and good news
GOLD (SELL) at 1647.30 | Stoploss: 1649.30 | TakeProfit: 1646.60 | Exited: 1646.60 | Profit: +70
GOLD (SELL) at 1659.52 | Stoploss: 1660.40 | TakeProfit: 1658.60 | Exited: 1659.30 | Profit: +22
GOLD (SELL) at 1659.65 | Stoploss: 1660.40 | TakeProfit: 1658.70 | Exited: 1659.32 | Profit: +33  

My Broker Sucks!: Trading Point

- Slow (suspiciously slow) to execute Orders
- Stoploss minimums are set way too high (no such thing as tight stoplosses with this company)
- Takeprofit minimums are set way to high (again, no such thing as tight takeprofits with this company)
- Their daily newsletter give little information (I use BarCharts.com's Newsletter to get daily updates instead)
- The spreads are ok, but neither are they special 

My advice to you, do not trade with these guys. I am sure you can find better, as I am doing right now.

My Current Fractal System (Update 1)

So, I've been working on this Fractal System of mine again today, and I think I came up with a good solution to my numerous fake breakouts and larger-than-I'm-comfortable-with Stoploss. First off, I decided to use Robert Miners Multiple Timeframe Method to clear out a few of the false signals, and I'm also using my current Fibonacci, Daily Pivots, Support/Resistance Lines, and Divergence setup to also find those possible tops and bottoms.

Secondly, I noticed that the few fake breakouts that occur still could bring in some profit if I had a Takeprofit to capture it. But how is one to know what level to set the Takeprofit? To solve this I decided to make two entry position equal to the allotment I'd use normally (ex. 0.5 + 0.5 = 1), that way I can take out half (doesn't have to be half; could 60%, or 75% or whatever), and use the other half (the rest) to carry on.

So, the first position will have a Takeprofit equal to the next closest fractal point (I use Barry's Support & Resistance indicator to help display this; also, if the next closest fractal point won't cover the spread, then go to the next higher/lower fractal), and then the second position will trail the low/high of the second closed bar (i.e. current bar - first closed bar, and second closed bar (the low/high of this one)). The Trailing Bar Low/High is another Robert Miner idea, only I go one bar further back then he would.

This should allow me to make a little bit of profit with a 'highly probable' takeprofit, and still be able to trail the price and gather a little more profit if the price happen to shoot up/down. And if none of this works, then I've lost nothing I would already lose if I didn't apply this setup.


USD/CHF: In Range & Near Support

The USD/CHF exchange has been having a down day so far, but I would expect it to jump up here pretty soon. Reason being:
 - The Range for USD/CHF (852) is in line with the 30 Day Average Range (832)
 - There is a Support Level it appears to be hitting (first purple line) (if this first purple line is broken, then I
    would expect the price to only fall as far as the next purple line, which is around two close Fibonacci Lines).
 - Some divergence is appearing with a couple of momentum oscillators (MACD, RSI, and CCI)
 - And the price is near a Pivot Support Line (DS1: 0.92460)


USD/CAD: Daily Pivot and Good News

I took a trade with USD/CAD this morning (BUY) thinking that the price will coninue to go up after a bounce off the Daily Pivot Line, and from the good news:

Unemployment Claims (Current: 351, Forecast: 357, Previous: 362)
Core PPI (Current: 0.2%, Forecast: 0.2%, Previous: 0.4%)
Empire State Manufacturing Index (Current: 20.2, Forecast: 17.6, Previous: 19.5)

AUD/USD: Bounce Off Top Trend?

AUD/USD appears to be bouncing off the black trend line shown in the first chart below. I think we can agree that AUD/USD is in a wedge, and will likely burst out of the wedge confines here soon enough (direction will depend on which trend line it breaks). Be care with this though. Because yesterday would have been a good sign that price was going to burst downward after it passed the support black trend line, but it instead decided to give you a fake breakout, and bounce up.


In addition, the AUD/USD price is bouncing off a Daily Support Level, and is just testing the 30 day Range of 1043... Possible sell opportunity?

Wednesday 14 March 2012

Tally For Today: -119

Things didn't go as smoothly as I'd hoped here today. Had only two trades:

USD/JPY (SELL) at 83.553 | Stoploss: 83.660 | TakeProfit: 83.480 | Exited: 83.660 | Profit: -107
 - entered trade because I thought a top was reached with that market: RSI, CCI, Momentum, and
   MACD were all showing divergence, and USD/JPY was hitting a good trend line
 - There was no Fibonacci Retracement Levels present, but I thought I could get away without them; turns out
    I was wrong on that

GOLD (BUY) at 1638.63 | Stoploss: 1636.85 | TakeProfit: 1640.60 | Exited: 1638.51 | Profit: -12
 - This trade was more of a test then anything, but I decided to include it anyway; I was testing out my fractal
    system (which still needs some more tweeking, but still looks pretty good)
 - I was rather disappointed with my broker on this one; I was in the green when I decided to close (around
    30 points), but it took more then 3 to 5 seconds before it finally exited my trade, which by then turned my
    trade into a loser

I've spent most of my day working on this fractal system, so I didn't trade as much her today. The system works well, but I think I need more of a buffer than just the CCI Zero Line Cross. Seems to be more false signals than I can get away with (which is usually the problem with fractals). Still looking though.

My Current Fractal System

I case you were curious about what my current fractal system is, I thought I'd explain what indicators I have and what I do with them.

Indicators:
  1. Daily Pivots
    - I keep the Daily Pivots indicator as a possible Support/Resistance point (I do not put too much
       emphasis on this indicator; more of a basic gauge of the market).
  2. Fractal Dimension Channels (0.5, 1.0, and 2.0 Dimensions) 
    - the green dashed line is the 2nd Dimension Fractal Channel, and is used as a possible stoploss point
        if I think that the 1st Dimension Fractal Channel is too close to the price; also used as a Major
        Fractal Breakout.
     - the purple dashed line is the 1st Dimension Fractal Channel, and I use this for stoploss points
     - the solid purple line is a very tight Fractal Dimension Channel I made using the same programming
        structure of the 1.0 and 2.0 Fractal Dimension Channel indicators (since it was tighter than the 1.0
        Fractal Dimension Channel I simply called it 0.5); I use this as my entry points.
  3. Fractal Histogram
    - in order to see the entry points more clearer I made this histogram to reflect the price breaking out
       of the 0.5 Fractal Dimension Channel; the blue lines represent the price breaking out above the 0.5
       Fractal Channel, and the red lines represent the price breaking out below the 0.5 Fractal Channel.
  4. CCI Histogram
     
    - this is used as a confirmation for my entry points; the colour of this indicator has to match the colour
        of the Fractal Histogram; if it does not do not enter a trade.


Out of Range: Time for Fractals

The range on USD/JPY is higher than normal, and yet I haven't seen the price drop down to correct this. I'm beginning to think that if the price is out of range and still not changing direction, then I'll trade using my fractal system I've setup a few months ago. That system was great for trending markets.

News for Today

The U.S. had some negative values with it here today, with the Current Account being -124B (Previous: -108B, Forecast: -114B) and Import Prices at 0.4% (Previous: 0.0%, Forecast: 0.6%). The only possible positive news is from Federal Chairman Bernanke little speech.

So all in all, I would expect the U.S. to look more negative today.

USD/JPY: Hitting Resistance Trend Line... and Nothing Else

USD/JPY is just hitting a good Resistance Trend Line (black line in chart), so one could expect a bounce. There is however, no other Fibonacci Retracement Lines at or near by the Resistance Trend Line. So the question is, should we risk just using the Resistance Line?


In addition to this CCI, MACD, RSI, and DTosc are all displaying divergence (trend reversals):


GOLD: Broken Support... New Support?

Gold made a break through of a really good support level, short after bouncing off of it. So now we need to find the new support level, and I think we are coming up to it.

There are two choices here, either gold is going use the purple line (double tap support area) or fall a little further into a zone of Fibonacci Retracement Lines (marked by the greyed circle).

Keep an eye on divergence for any trend reversals and trend continuation signals.


Tuesday 13 March 2012

Gold: Upward Bounce?

With price hitting and bouncing off the downward trending black line, and is also bouncing off the extreme Support line (purple line). This could result in a nice jump upwards.


Trades for Tuesday: +371

The Range, Pivot, and CCI setup worked well today. I made five trades today, all successful (I have one trade still in motion, but expect it to close anytime soon).

GOLD (BUY) at 1690.41 | Stoploss: 1682.50 | TakeProfit: 1693.40 | Exited: 1691.33 | Profit: +92
 - the profit, if I waited for the takeprofit, would have been +299


EUR/USD (BUY) at 1.30676 | Stoploss: 1.30470 | TakeProfit: 1.30780 | Exited: 1.30743 | Profit: +67
 - the profit, if I waited for the takeprofit, would have been +104


USD/CHF (SELL) at 0.92233 | Stoploss: 0.92490 | TakeProfit: 0.92180 | Exited: 0.92180 | Profit: +27
 - this trade I didn't want to enter, given that I was already in two other experimental trades, so I made this a
    paper trade instead
 - I did not exit early on this, and waited until the takeprofit was reached 


GBP/USD (SELL) at 1.57351 | Stoploss: 1.57500 | TakeProfit: 1.57210 | Exited: 1.57272 | Profit: +79
 - made trade according to higher range, price hovering around DR2 price pivot (1.57350), and CCI crossed
   100
 - exited early because price was bouncing within the extreme high and just above 23.6 Fibo Line

GBP/JPY (SELL) at 130.074 | Stoploss: 130.235 | TakeProfit: 129.880 | Exited: 130.054 | Profit: +20
 - made trade according to higher range, price hovering around mR3 price pivot (130.13), and CCI crossed
   100
 - exited early because price was bouncing within the extreme high and just above 23.6 Fibo Line 

Open Trades: 
GBP/JPY (SELL) at 130.256 | Stoploss: 130.400 | TakeProfit: 129.950   

----------------------------------------------------------------------------------------------------------------------------------------
Updated:

 GBP/JPY (SELL) at 130.256 | Stoploss: 130.400 | TakeProfit: 130.170 | Exited: 130.170 | Profit: +86
 - changed the TakeProfit to a lower value (130.170) because I saw the price moving a little more higher every
    15 minutes; chose 130.170 because it was just above a possible minor support level
     

3 Trades, 3 Wins

I've been trying out this new method using Daily Pivots, Daily Range, and CCI, and so far it's working out great. I've made three trades on Gold, EUR/USD, and USD/CHF, and all three worked perfectly. The range for all three markets were around yesterday's range and the 30 day average range, so i then assumed that a reversal was pending. In addition to the range, the price also reached a support/resistance pivotal line, which made a reversal all the more likely. Next I waited for CCI to cross the 100/-100 line in order to make my entry. On all three trades I picked my stoploss a few points below the latest fractal extreme, and my takeprofit according the closest Fibonacci Retracement Level (usually 23.6).

The unfortunate part was that I did not wait for the takeprofit to exit my trade, and instead exited early. So, I lost out on additional profit.

Here are my trades:

Gold (BUY) at 1690.41 | Stoploss: 1682.50 | TakeProfit: 1693.40 | Profit: +92
 - the profit, if I waited for the takeprofit, would have been +299
EUR/USD (BUY) at 1.30676 | Stoploss: 1.30470 | TakeProfit: 1.30780 | Profit: +67
 - the profit, if I waited for the takeprofit, would have been +104
USD/CHF (SELL) at 0.92233 | Stoploss: 0.92490 | TakeProfit: 0.92180 | Profit: +27
 - this trade I didn't want to enter, given that I was already in two other experimental trades, so I made this a
    paper trade instead
 - I did not exit early on this, and waited until the takeprofit was reached

Technical Analysis is First, News Second

Retail Sales/Core Retail Sales for the U.S. came out this morning with a positive values, so I would have expected the USD/CAD exchange to go up right? Not so. Because of the current position of the price for USD/CAD would most likely behave negatively from a technical analysis point of view, so the price, instead of going up like it should have, went down (the circled first bar is the downward movement after the Retail Sales was released):


Now, this is the next bar, which does reflect the positive news that was released (all it had to do was drop to the appropriate trend support level before applying the positive news for a upward price movement):


Monday 12 March 2012

Tally For Monday: +255

USD/MXN (SELL) at 12.71430 | TakeProfit: 12.69550 | Stoploss: 12.74430 | Profit: +285
 - I decided to exit a little early because I was unaware that my broker has changed how many decimal places
    this market was set at; usually it would be 12.714 for an entry point, now I got 12.71430; you can imagine
    how it looked when I saw +285 profit, and my TakeProfit hadn't even exited the trade hahaha.

Crude Oil (BUY) at 106.45 | TakeProfit: 106.50 | Stoploss: 106.15 | Profit: -30
 - made call on divergence that formed with CCI 
 - was stopped out at 106.15

AUD/USD: Support From Drop?

Looks like we're getting some support from the black trend line shown. End of our 5 Wave?


USD/MXN: It's Goin' Down

Made a good call this morning with the USD/MXN exchange, where I believed that the price was going to bounce off a support area (purple line):


Now it's heading downward:


Well, downward enough to give me a profit (+285).
Although it is going down right now I would not count on it staying like that for very long. It is still in a small uptrend, and I wouldn't make any moves for long term downward prices.

GBP/USD: Support Area (Update 1)

Price is still bouncing around this support zone:


GBP/JPY: Support

I have the GBP/JPY hitting a good support area with several Fibonacci Retracement Lines collecting in the current price's area, and a support line that had a 'double tap' occur:


GBP/USD: Support Area

Two Fibonacci Retracement Lines are lined up with each other (161.8 and 50.0) giving a likely support area:


News Today: Not A Lot

Not much coming up in the economic indicator department. We have a Federal Budget Balance (U.S.) coming up at 11:00AM (Pacific), and later this afternoon and evening we have a couple reports release for New Zealand, Japan, and Europe, which all should be low key. There is a Home Loans report at 5:30PM (Pacific) from Australian that should bring about some volatility (according to the forecast by Forex Factory it should cause the price to fall... 61.8 Fibonacci Line?).

AUD/USD: Support From Drop?

Looks like we are at the black support line! Now we'll see if the price bounces off it, or fall further to the 61.8 Fibonacci Retracement Line (1.04320) to make our 5th Elliott Wave:


Here's an older chart from early this morning, showing the downward fall and the breaking of a support area:


CRUDE OIL: Pivot Levels and Divergence

Looks like crude is going making a slight move upwards now that it's on the Daily Support 1 Pivot Level, while at the same time showing support with CCI and RSI (green lines); seriously considering a buy in... if it holds:


In terms of Fibonacci and Support/Resistance Lines, I am not seeing a whole lot. There is some support coming from a 50 Fibonacci Retracement Line, but since the price passed through the upward trend support line (black line) I would expect it would drop... proceed with caution though.


GOLD: Divergence

Divergence with DTosc, CCI, and MACD occurred earlier on during the European Open; will be waiting for new opening:


There is appears to be some support action occurring with the black trend line shown in the chart. This could result in a bounce upward, as it appears that gold is already in a trend. If it does not bounce back up I would expect it would drop to the next black trend line (this should be a great support given that it's a double tap both as a support and resistance):

Sunday 11 March 2012

AUD/USD: It's Still Dropping!... Fantasic!

Looks like the AUD/USD exchange is going down further, which is what I hoped would happen. The only question now... to what level: the support area (~1.05080, lower red line) or off a lower support trend line (black line)?

Friday 9 March 2012

Tally for Today (-196) and this week: +202

Had a great profit this week!... That is after today. Made and missed almost all my trades today since I was not complete focused on my charts, and more focused on blogging and posting. Had only two trades today:

GBP/USD (BUY) at 1.57292 | TakeProfit: 1.57322 | Stoploss: 1.57090 | Profit: -202
 - exited at my stoploss
 - made trade because of divergence with MACD and CCI
GBP/USD (BUY) at 1.56925 | TakeProfit: 1.56950 | Stoploss: 1.56620 | Profit: +6
 - exited early due to uncertainty of trade
 - made trade because of new divergence with MACD and CCI

Well, despite the set back here today my trades this week came out on top. Just have to focus a little more on my charts.

P.S. Updated 'My Progress' sidebar to show my weekly profits and total profits (won't do my daily profits in that sidebar; too much of a hassle).


AUD/USD: Long-Term Price Action

I'm going to go out on the limb here, and make a bold prediction of where AUD/USD price action will go in the coming days (pardon the childish arrow drawings):


Please remember not to take this too seriously. I'm only making a prediction.

AUD/USD: Elliott Wave Formation... or Upwards Trend?

It is a strange day for the AUS/USD exchange today. As I pointed out in the previous post that the U.S. dollar was going downward due to less than stellar Trade Balance and Employment/Unemployment values, but this should have had a positive effect on the AUD/USD market. Right now the Australian dollar is taking a huge dive, and the only conceivable reason I can think of is that traders are more focused on the AUD/USD forming a downward 5th Elliott wave. It is also quite possible that the price will bounce of the black trend line I've drawn, and start channeling.

GBP/USD: Divergence

After the negative U.S. and Canadian Trade Balance release, along with employment and unemployment rates, the majority of the forex markets are taking a dive. But I'm seeing some divergence in the smaller timeframes (1 hour and 15 min) that could signal a reversal, or at least a slight jump upward:


Thursday 8 March 2012

AUD/USD: Aussie Trade Balance Release (Update 1)

Looks like the Trade Balance is considerably lower than expected. If I were to lean on a direction I would say, without a doubt, the downward direction. So, you might be looking at a drop past 1.05070 (hopefully), according to Elliott Wave Theory.

AUD/USD: Aussie Trade Balance Release

At 4:30PM (Pacific Time) the Trade Balance for the Australian Dollar should be leased, and according to Forex Factoryès forecast it's probably going to be lower than the previous month. If that is true than the price should drop past the 1.05070 mark (Lower Large Red Line; value from previous extreme low).

If not, the it should go up to no further than 1.07220 (Higher Large Red Line; 61.8 Fibo Retrace Line; extreme low point from past price action; and, if using Elliott Wave Theory, this should be wave 4 which should not pass into wave 1's price zone).


First Trade of the Day: AUD/USD

One trade so far here today. Discovered this one using divergence from both RSI and Momentum, as well as a bounce off of a Support line, and a 23.6 Fibonacci Retracement Line (unfortunately, I was a little late at grabbing this one; I would have preferred to buy at the close of the previous bar (1.05952); didn't wait for the close of the current bar since I was late in this trade):

AUD/USD (BUY) at 1.06014
TakeProfit: 1.06050
StopLoss:  1.05850                     
Profit of +8

Based stoploss off of fractal point, and placed my takeprofit just below the 23.6 Fibonacci Retracement Line.

Missed Reversals

I`m seeing a wide range of reversals today USA/CHF, GOLD, EUR/USD, etc., I`m afraid that I missed my opening, and would be add more risk if I were to trade.

Wednesday 7 March 2012

Tally For Today: +95

Made two trades:

AUD/USD at 1.05369 (BUY), with a profit of +48
USD/CAD at 0.99933 (BUY), with a profit of +47   
                                                            Total:   +95

Made both calls from MACD divergence and Support areas; Stoploss was set a very points below earliest fractal point; and TakeProfit was set just below the earliest Fibonacci Retracement level.

If I add the Points made yesterday I have a profit of +461, and I have not received a loss... yet.
In case you`re wondering, the 'My Progress' sidebar showing all my profit and loss is from a system I was testing earlier, and decided not to keep it: too many fakeouts. So please ignore it until I fix it. 

A Word On 'Elliott Wave Principle' by Frost & Prechter: The News

I just received the book 'Elliott Wave Principle' by Frost & Prechter, and already I`m labeling it as a good book. I made it through the boring preliminaries: Publisher Note, Foreword, and Author`s Note sections. I soon skimmed the book and stumbled across a fantastic excerpt on economic news:

 ``While most financial news writers explain market action by current events, there is seldom any worthwhile connection. Most days contain a plethora of both good and bad news, which is usually selectively scrutinized to come up with a plausible explanation for the movement of the market.``

Well put sir!
And yet, never the less, we still need to watch for the economic report released, and breaking news developments. For me personally, I like to see what the economic reports are saying, and attempt to find a connection (although I rarely do). But I don`t watch CNBC, just because it`s constantly bombarding me with commercials, and giving me little or no information on the markets I`m watching. If I were ever to find current news developments I would be looking on the Websites: Google News, MarketWatch, Bloomberg, and most importantly Forex Factory (easy to grab information; you get discussions on the news articles presented; and it is just pleasant to look at).

But my general view of market News and Reports is summed up by Frost & Prechter paragraph.

Paper Trades from Yesterday

My paper trades from yesterday were fantastic!
I made four trades:
GBP/USD at 1.57040 (BUY),   with a profit of +223
AUD/USD at 1.05510 (BUY),  with a profit of +34
USD/CAD at 1.00130 (SELL), with a profit of +84
Crude Oil   at 104.86 (BUY),    with a profit of +25     
                                                              Total: +366

Not bad for a couple of guesses. If you`re wondering how I made this profit then I would say Fibonacci Retracements, Fibonacci Time Lines, Divergence, and Support/Resistance Levels. All of which helped me determine the price reversal of all four markets.

For today I`m looking more at the 15 minute timeframe, and searching for divergence with my momentum oscillators (CCI, RSI, MACD, and Momentum).

The Morning


Good morning Traders and Canadians!
Looks like we have a lot of news here this morning, and even more this afternoon.
So far the Canadian side of things is looking a little negative with Building Permits (-12.3%) being lower than the prediction (-3.1%), and lower than the previous month (10.5%).

Where as the U.S. is looking more on the Bright side of things with  ADP Non-Farm Employment Change (216K from 173K), Revised Nonfarm Productivity (0.9% from 0.7%), and Revised Unit Labor Costs (2.8% from 1.2%) all going in a positive direction.

So, with these fundamental notes I can wager that USD/CAD market is leaning upwards, the EUR/USD will be leaning downwards, and Crude Oil will be leaning downwards as well (waiting for EIA to show weekly supplies before making a move on that though). Along with any other currency tied in with the U.S. dollar I would expect they would decrease in value today.

Later this afternoon should be more news coming from Europe, Asia, Australia, etc., so if those values are positive I can see them masking the positive data from the U.S.
 

Tuesday 6 March 2012

AUD/USD: A Pending Bounce Up...?

Daily shot of the AUD/USD exchange; looking for a possible area for a bounce, and came up with a couple spots:
- 1.04000 to 1.03500 range (shown by the large orange box), and I say this range given the areas of support/resistance with multiple double tops.

- Another is the larger timeframe Fibo line 23.6, which is a little closer to the current price, and may indicate a sooner-than-later bounce.

- Additionally, we can see a possible Fibo Cycle coming to an end currently; which will add to the Fibo 23.6 line prediction.

So, given these possibilities I would have to lean on the a bounce occurring relatively soon, especially if RBA's Deputy Governor Philip Lowe Speech is about good news, and the AIG Construction Index is positive. If said speech and/or index is rather negative then I might be inclined to suspect a further drop.


High Propability Strategies (Robert Miner)

In addition to the Bill Williams books, I've been reading over Robert Miners book 'High Probability Trading Strategies'. It is a very good book, and very helpful in making a great trading strategy. You can use Miners ideas on your current trading strategy, or trade fully on his methods alone. I've come across a couple forums and blog sites that follow Miner's ideas in full, and they seem to be doing quite well. Here's a blog site that follows trades made on all the major currencies using Miner's methods:

Monday 5 March 2012

A Word on Divergence

The reason why I rely so heavily on Divergence is because it's the most reliable way to determine reversals and continuations of the current trend. I've always came across articles, forum discussions, youtube videos, etc. that all tell me to use some other indicator or method to place orders, and not rely on just divergence. But that is all they say on the subject! Nothing about what indicator would work best!

As far as I can tell the best indicator to work with divergence is the one that comes close to predicting tops and bottoms such as the TTM Scalper indicator, TMA indicators, Stochastic, DTosc, various Fractal indicators, and more of that nature. But even those are not the greatest at picking up the divergence moves. Some of the divergence that appears is gone by the end of the next bar, and by that time any indicator that tries to determine the tops and bottoms is useless. The vast majority of indicators out there need at least one bar to close before making a prediction as to whether the market is making a top or bottom. The rest of the indicators that don't need that one bar to close are recalculating/repainting indicators.

So far I think the best option would be to find divergence in the higher timeframe, and then look to the smaller timeframe for your entry points using those indicators I pointed out. For example, 1 hour timeframe shows divergence, then move to a 15 minute timeframe, and use DTosc for an entry point (stoploss above/below the lasted fractal point; exit by trailing stop). 

And if that doesn't float your boat, and you want to be a little more risky, you can enter as soon as you see the divergence. I've been doing some paper trading with this option, and so far it is not too bad. But like I say it is risky, and high risk is thee enemy of Day Trading. So, maybe you'd want to stick with the multiple timeframe strategy for now.

Divergence: USD/CAD 8:30AM


Lots of divergence this morning with USD/CAD. Hope you caught some of it!
MACD is showing some bigger hidden divergence moves (added reversal divergence move that occurred last Thursday just for fun). While CCI and Stochastic show some more hidden divergence earlier on, and RSI plus Momentum are showing support levels.

Bill Williams 'New Trading Dimensions': Tough to Read

Well, it is not too tough in the sense I can't understand it. The only problem is that I download this book, and it doesn't include the charts and figures. UGH!
So I can try to interprate the words given to explain the charts and figures, but I get the feeling that this will be harder than I'd think.
Oh well, I just stick to my divergence trading for now, and pick up any pieces from this incomplete book.

Sunday 4 March 2012

Bill Williams Fractal System... A Possibility?

To help with these fractal breakouts I believe I'll start reading the book by Bill Williams on how he traded with fractals. The reason I haven't done this sooner is when I first started to day trade I would use the Alligator indicator. It was interesting at first, but I soon found out, at the time, is that it doesn't work as well as some other indicators I've come across, such as RSI or Stochastic.

But I've been dancing around with fractals long enough that I ought to, at least, try the original method used for this indicator. If I'm not mistaken, I think I have to throw in a couple other indicators I've written off a long time ago, such as Awesome and Accelerator. Well, I guess we'll see how it plays out.